Qwen3.6-35B-A3B on a 16 GB RTX 5060 Ti: Why Context Beats Tok/s for Coding
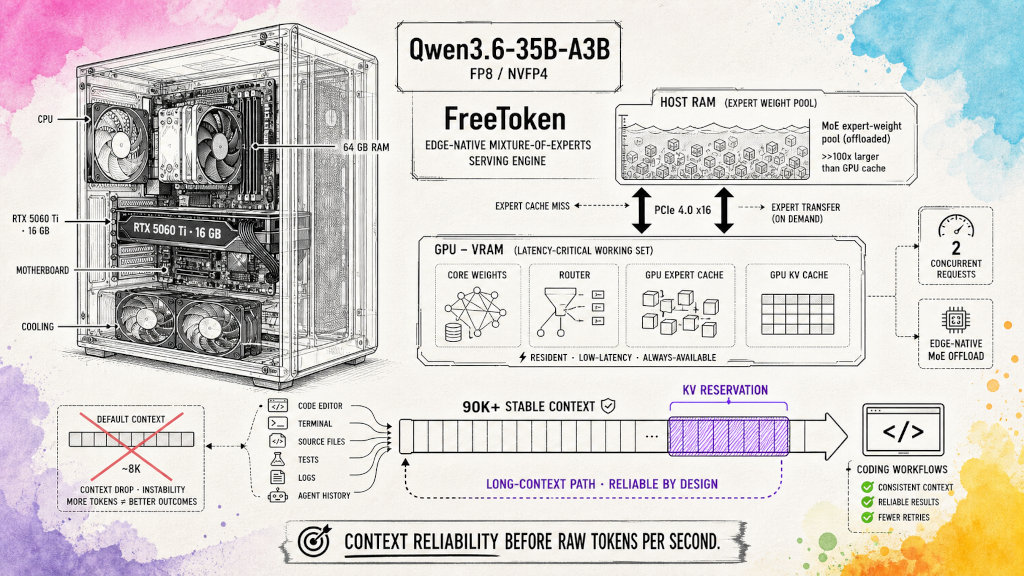
A 16 GB GPU cannot hold a 35 GB FP8 model checkpoint in VRAM. Yet Qwen3.6-35B-A3B can still run locally on an RTX 5060 Ti through FreeToken—in both its FP8 and NVFP4 weight formats: core weights and active caches stay on the GPU, the mixture-of-experts (MoE) expert pool stays in system RAM, and FreeToken fetches experts across PCIe when the GPU cache misses.
The interesting result is not that the smaller GPU is fast—it is not as fast or as concurrent as a 24 GB RTX 4090. The result is that a correctly configured 16 GB card can reliably accept a 92,436-token prompt. For repository-scale coding, that capability is usually more valuable than gaining a few tokens per second while leaving the server unable to accept the code, logs, tests, and history required to solve the task.
This article reproduces the KV-cache reservation method from a larger RTX 4090 deployment on a desktop RTX 5060 Ti. It shows the same default allocation trap, validates a safe long-context configuration, documents an OOM failure caused by optimizing for short-prompt throughput, and measures the resulting single-request and two-request performance. It then compares the two weight formats end to end on this hardware: throughput (NVFP4 is roughly 2.5× faster), correctness (a 50-task quality eval finds one narrow NVFP4 regression), and the real memory footprint of each (VRAM is quantization-independent; system RAM is not).
This article assumes you have served an LLM before. Key terms are defined at first use: KV cache is the per-token state that grows with the context window; prefill is the phase that processes the input prompt before generation starts; CUDA graphs are pre-captured GPU execution plans that cut per-request launch overhead.
Test system
| Component | Specification |
|---|---|
| CPU | Intel Core i5-13400, 10 cores / 16 threads, up to 4.6 GHz |
| RAM | 64 GiB (62 GiB usable) RAM, 64 GiB swap |
| GPU | NVIDIA GeForce RTX 5060 Ti, 16.3 GiB (16,311 MiB) VRAM, compute capability 12.0 |
| PCIe link | PCIe 5.0 x8 negotiated under sustained load |
| OS | Ubuntu 24.04.4 LTS, kernel 6.8.0-138-generic |
| NVIDIA stack | Driver 595.84, CUDA 13.3 |
| Model | Qwen3.6-35B-A3B in two weight formats: FP8 (~35 GB on disk) and NVFP4 (~22 GB on disk) |
| Runtime | FreeToken with --moe-backend offload |
This is a normal desktop rather than a headless inference server. A live desktop session keeps part of VRAM occupied by the compositor and related graphics allocations. Immediately before model loading, usable free VRAM was consistently only 14.24–14.28 GiB, not the card's nominal 16.3 GiB.
The RTX 5060 Ti negotiated PCIe 5.0 x8 while the model was actively generating. This matters because FreeToken uses the host-to-GPU link whenever an expert requested by the router is absent from the GPU expert cache. Do not judge the link from a single idle reading of pcie.link.gen.current: PCIe power management can report a lower generation when traffic is absent. Measure link state under sustained work.
What FreeToken makes possible
The FP8 checkpoint is larger than the GPU's VRAM, and even the smaller NVFP4 checkpoint (roughly 22 GB) does not fit. FreeToken makes the deployment possible by dividing the model and its runtime state across the resources that are actually available:
- Attention, routing, embeddings, and other always-needed components remain GPU-resident.
- A limited working set of recently used experts is cached in VRAM.
- The much larger expert pool remains available in host RAM.
- On a GPU-cache miss, FreeToken transfers an expert from RAM across PCIe rather than requiring the entire checkpoint to fit in VRAM.
- GPU VRAM is also shared with KV cache, which holds the per-token state required for the active context window.
View PlantUML source code
@startuml
skinparam componentStyle rectangle

package "FreeToken server" {
  component "OpenAI-compatible API" as API
  component "Scheduler and batching" as Scheduler
  component "GPU core weights\nattention + router" as Core
  component "GPU MoE expert cache\n(LRU)" as ExpertCache
  component "GPU KV cache" as KV
}

component "Host RAM\nexpert-weight pool" as RAM
component "RTX 5060 Ti\n16.3 GiB VRAM" as GPU

API --> Scheduler : requests
Scheduler --> Core : token batches
Core --> ExpertCache : routes top experts
ExpertCache --> RAM : cache miss\nfetch over PCIe
RAM --> ExpertCache : expert tensors
Core --> KV : reads and writes\ncontext state

Core -[hidden]-> GPU
ExpertCache -[hidden]-> GPU
KV -[hidden]-> GPU
@enduml
System RAM is therefore not a secondary convenience. It is what makes the full 35 GB checkpoint available to a 16 GB GPU. VRAM remains the scarce performance resource: it must be split between the expert cache, the KV cache, activations, CUDA graph buffers, and runtime safety margin.
The default context trap
The model reports a 262,144-token context capability:
{"max_model_len": 262144, "context_length": 262144}
That metadata did not describe the initial server configuration. With automatic MoE-cache sizing and no explicit KV reservation, FreeToken reported:
Allocating 8330 tokens for KV cache, K + V = 0.16 GiB
--moe-cache-auto resolved moe_cache_size=2921 num_pages=8330 (prefill_overlap=True)
The automatic policy prioritized the MoE expert cache and left the KV cache close to its default reservation floor. The effective context budget was therefore only 8,330 tokens:
A request containing 24,028 input tokens failed before inference began:
WARNING Input sequence length 24028 exceeds 8330, request 1 is dropped.
{"error": {"message": "..."}, "status_code": 400}
The lesson is simple but critical: the context number in a model card or /v1/models response is a model capability, not a guarantee that the current server has allocated enough KV cache to use it.
For a chat workload, 8K may be acceptable. For a coding agent that needs instructions, source files, tests, tool output, logs, diffs, and a persistent task history, it is not.
Choosing a safe KV reservation
On a 16 GB GPU, KV cache and MoE expert cache compete intensely for the same VRAM. Reserving more KV tokens leaves fewer expert-cache pages. Reserving fewer KV tokens can improve short-prompt performance, but it can also produce a server that fails when it receives the long prompt it was supposed to handle.
Three configurations were tested against a 92,436-token prompt:
--kv-reserve-tokens | KV memory | MoE cache size | Free VRAM after CUDA graph capture | Outcome on 92,436-token prompt |
|---|---|---|---|---|
| 8,192 default | 0.16 GiB | 2,921 pages | — | Rejected before inference; effective cap 8,330 |
| 300,000 | 5.72 GiB | 1,020 pages | 1.07 GiB | Succeeded in 47.45 s |
| 260,000 selected | 4.96 GiB | 1,273 pages | 1.07 GiB | Succeeded in 44.70 s |
| 120,000 | 2.29 GiB | 2,192 pages | 1.07 GiB | CUDA OOM; backend worker died |
The selected 260000 setting safely accepted the 92K test prompt while retaining a workable expert cache. It was used for the benchmark results in this article:
ft serve \
  --model-path ~/llm_models/Qwen3.6-35B-A3B-FP8 \
  --moe-backend offload \
  --served-model-name qwen3.6-35b-a3b \
  --host 127.0.0.1 \
  --port 8000 \
  --cuda-graph-max-bs 2 \
  --max-running-requests 2 \
  --kv-reserve-tokens 260000
The failure mode at 120K
The 120,000-token reservation had the largest MoE cache among the explicit configurations. On short and medium prompts, it produced the best raw generation rates measured in this experiment—roughly 25 tok/s, versus approximately 19–26 tok/s with the selected configuration.
But that short-prompt result was misleading. When given the 92,436-token input, the server failed during execution:
torch.OutOfMemoryError: CUDA out of memory. Tried to allocate 64.00 MiB.
GPU 0 has a total capacity of 15.46 GiB of which 93.81 MiB is free.
The backend worker died, leaving the service unresponsive until it was restarted.
Note the distinction between this failure and the one documented later in the correctness eval: the 120K failure is a configuration failure — the reservation was simply too small for the target prompt. The 260K failure is a session-shape failure — the reservation is correct, but sustained continuous serving exhausts the ~0.6–0.7 GiB margin before a long prompt arrives. Both are OOMs; they have different causes and different fixes.
This is the most important operational finding of the test. A configuration that wins a short-prompt tok/s comparison can still be the wrong configuration for a coding server. If it crashes when someone supplies a large diff, a long build log, several source files, or accumulated agent context, its higher median throughput has little value.
Tune FreeToken for the largest prompt you intend to serve, and leave runtime margin for activations, CUDA graph capture, Triton autotuning, and transient allocations. Do not treat a server that merely starts as a validated long-context server.
Verifying 92K context
With --kv-reserve-tokens 260000, a synthetic prompt containing 92,436 input tokens was successfully processed. It consisted of repeated material with an embedded comprehension question; the model correctly identified the planted detail located deep in the input.
The request completed in 44.70 seconds:
{
  "usage": {
    "prompt_tokens": 92436,
    "completion_tokens": 23,
    "total_tokens": 92459
  }
}
This was a single request (n=1): the 44.70 s figure is one observation, not a distribution. Given the run-to-run variance this setup exhibits (documented in the benchmark and correctness sections below), treat this as a demonstration of capability — the server accepted and completed a 92K prompt — rather than a throughput claim.
This result does not imply that the RTX 5060 Ti is faster than a 24 GB GPU. It proves something more useful for deployment design: after explicit KV planning, the model's hybrid-attention design keeps the per-token KV cost low enough for a 16 GB consumer GPU to retain a substantial long-context window.
The result should be reported precisely:
- Verified prompt length: 92,436 tokens.
- Verified effective context: at least 92,459 total tokens for this request.
- Configured KV reservation: 260,000 tokens.
- Not yet independently verified in this test: a request at the full 262,144-token model limit.
This distinction matters. A configured cache capacity is not the same as an end-to-end verification at the absolute limit. The correct operational statement is that the server reliably demonstrated 92K context in the tested workload, with configuration capacity intended for much more.
Real memory footprint: what it actually costs
Every number in this section is read directly from ft serve startup logs and nvidia-smi/free -h on this machine, not estimated. If you are sizing hardware for this model, these are the numbers that matter.
VRAM: measured, not theoretical
The KV cache scales linearly with the token reservation, confirmed across all four tested configurations:
--kv-reserve-tokens | KV cache size (measured) | GiB per 1M tokens |
|---|---|---|
| 8,192 (default floor) | 0.16 GiB | ~19.5 |
| 120,051 | 2.29 GiB | ~19.1 |
| 260,029 (selected) | 4.96 GiB | ~19.1 |
| 300,000 | 5.72 GiB | ~19.1 |
The "GiB per 1M tokens" column is a ratio of the two measured values (cache size ÷ reservation), not a separate measurement — it is shown to demonstrate the linear scaling.
At ~1.907×10⁻⁵ GiB/token, reserving the model's full native 262,144-token context would cost only about 5.0 GiB of KV cache by itself. That is not the binding constraint on this card — the constraint is everything else that must also fit:
| VRAM component (FP8, 260K config) | Size |
|---|---|
| Free VRAM before model load (desktop already using the rest) | 14.24–14.51 GiB of 16.3 GiB total (varied slightly across test sessions/days) |
| Core weights + GPU-resident MoE expert cache + KV cache, combined | ~13.2 GiB (derived: free-before-load minus free-after-init) |
| — of which KV cache alone | 4.96 GiB |
| Free VRAM after full init, before CUDA graph capture | 1.16–1.18 GiB |
| Free VRAM after CUDA graph capture | 1.07–1.15 GiB |
| Steady-state VRAM used (idle, no requests in flight) | ~14.7–14.75 GiB of 16.3 GiB |
| Peak VRAM during an actual 150K-token long-context request | ~15.6–15.7 GiB of 16.3 GiB |
NVFP4 shows essentially the same VRAM profile — idle usage ~14.7 GiB, long-context peak ~15.7 GiB — because --kv-reserve-tokens dominates the allocation on this card at this context length, not weight precision. NVFP4's smaller weight footprint frees RAM (see below), not VRAM.
The peak number is the one that matters for reliability: at ~15.6–15.7 GiB used, this card has only ~0.6–0.7 GiB of margin left when actually serving a long prompt. That margin is what got consumed during a later 50-task correctness eval on this same 260K config (see "Correctness: a 50-task quality eval" below), causing a genuine torch.OutOfMemoryError after ~47 minutes of continuous prior serving — the same configuration that passed the 92K single-request test cleanly failed when long-context ran last in a long session. A validated configuration is validated for a session shape, not permanently immune to memory pressure.
System RAM: the expert pool is the real cost
Host RAM holds the MoE expert pool that does not fit in VRAM. Measured directly from server startup logs:
| Quantization | Expert pool size (RAM) | Idle desktop RAM already in use | Total system RAM in this box |
|---|---|---|---|
| FP8 | 31.4 GB | ~14 GiB of 62 GiB | 64 GiB (62 GiB usable) + 64 GiB swap |
| NVFP4 | 21.8 GB | ~14 GiB of 62 GiB | 64 GiB (62 GiB usable) + 64 GiB swap |
On this desktop, the OS and background processes alone already use about 14 GiB of RAM before any model is loaded. Add the FP8 expert pool (31.4 GB) and roughly 45 GB is committed before the server has handled a single request — which is why 64 GB, not 32 GB, was the right call for this build. NVFP4's 21.8 GB pool leaves noticeably more headroom on the same box (~35 GB committed instead of ~45 GB), though this test did not push either quantization to a lower-RAM configuration to find where it actually breaks.
Minimum vs. recommended vs. maximum-tested
To answer directly: what memory do you need for what context window, on this exact model and card?
| VRAM | System RAM | |
|---|---|---|
| Minimum to load the server at all (default 8,330-token effective context, no tuning) | ~14.3 GiB free — nearly the whole 16.3 GiB card; weights + MoE cache dominate even at minimal context, not KV cache | 31.4 GB (FP8) / 21.8 GB (NVFP4) for the expert pool, plus OS overhead — 64 GB was the tested floor |
Recommended: validated for 92K+ single requests (--kv-reserve-tokens 260000) | ~14.7–14.75 GiB steady state, up to ~15.6–15.7 GiB under an actual long prompt, out of 16.3 GiB total | Same 64 GB box; raising KV reservation has no RAM cost — that cost is VRAM-only |
| Maximum verified in this test | 92,436-token single request confirmed end-to-end; 150K-token prompts confirmed to pass in isolation (qualbench long-context category); full 262,144-token native context was not independently verified | Not applicable — RAM cost is fixed by quantization choice, not by KV reservation |
The practical takeaway: on a 16 GB consumer card, VRAM is the scarce resource at every context size, not just at the maximum. This model's core weights and MoE expert cache already consume nearly the entire card before a single KV token is reserved — the "minimum" and "recommended" VRAM requirements are much closer together than the KV-cache math alone would suggest. System RAM, by contrast, is fixed per quantization (31.4 GB vs. 21.8 GB) regardless of how much context you reserve, so it is the quantization choice — not the context-window target — that determines the RAM floor.
Why context beats tok/s in coding
For serious coding tasks, prompt capacity is often the hard constraint. Generation speed matters, but it does not help when the model cannot accept the evidence needed to solve the task.
A repository-scale request can include:
- Repository instructions, architecture rules, and security constraints.
- Source files across multiple modules or services.
- Tests, test fixtures, build files, dependency manifests, and CI/CD configuration.
- API contracts, schemas, database migrations, generated code, and deployment manifests.
- Compiler output, stack traces, logs, failed-test output, diffs, and review comments.
- The coding agent's prior investigation, tool results, patches, and decisions.
The benchmark's multi-module code-review prompt alone used 17,515 tokens. That is already more than twice the server's default 8,330-token effective context. A broader code review, a long debugging session, or a selected slice of a repository can easily enter the 60K–100K range.
For that reason, a coding assistant that reliably accepts 90K+ tokens at 20 tok/s is often much more useful than one that produces 25 tok/s on short prompts but rejects long inputs or crashes near its advertised context range.
The practical workflow is retrieval plus large context, not “send the whole repository every time”:
- Use code search, symbol navigation, dependency analysis, and tests to identify the relevant files.
- Put the selected evidence into context: instructions, contracts, implementations, tests, configuration, logs, and prior agent output.
- Preserve the selected evidence across multiple tool-using turns instead of repeatedly summarizing it away.
- Reserve 90K+ context for cross-cutting changes, code review, migrations, broad debugging, and long-running agent tasks.
The asymmetry is fundamental:
- Too little MoE expert cache usually means a slower response due to more cache misses.
- Too little KV cache means the request is rejected, truncated, or may fail under long-context runtime pressure.
For a coding server, the second failure mode is worse. That is why the tuning priority should be reliable usable context first, then throughput within the remaining VRAM budget.
One checkpoint, three weight formats
The measurements in this article use two of the three published representations of Qwen3.6-35B-A3B, so it is worth being precise about what differs between them—and what does not—before comparing throughput.
Qwen/Qwen3.6-35B-A3B (BF16), Qwen/Qwen3.6-35B-A3B-FP8, and nvidia/Qwen3.6-35B-A3B-NVFP4 are the same post-trained multimodal MoE checkpoint: 35B total parameters, about 3B active per token, 262K native context. The difference is only the weight representation. The practical choice is BF16 for maximum portability and reference accuracy, FP8 as the balanced default on modern NVIDIA GPUs, and NVFP4 for the smallest weight footprint and highest serving density on Hopper/Blackwell within the NVIDIA stack. The full format comparison table is in the appendix.
Architecturally, these are not three different models and not three fine-tunes: MoE with 256 experts (8 routed plus 1 shared active per token), 40 layers in a hybrid scheme combining Gated DeltaNet (a linear-attention layer that keeps per-token KV cost low) and periodic attention blocks, a vision encoder, and native 262,144-token context (extending to roughly 1.01M requires static YaRN, a rotary-position-scaling technique, and can degrade short-context behavior). The base model card's coding-agent scores include 73.4 on SWE-bench Verified, 49.5 on SWE-bench Pro, 51.5 on Terminal-Bench 2.0, and 37.0 on MCPMark. These describe the model line itself, not an independent comparison of the three formats on identical hardware.
Quality-wise: BF16 is the reference point, preferred when quantization must not be a variable (LoRA/QLoRA pipelines, activation analysis, custom quantization, quality validation). FP8 is Qwen's official fine-grained checkpoint with 128-element blocks; Qwen states its metrics are nearly identical to the original, and FP8 preserves a larger numeric range than 4-bit. NVFP4 is NVIDIA's quantization via Model Optimizer—not a plain 4-bit GGUF/AWQ conversion: it quantizes weights and activations of the linear operations in the transformer/MoE blocks while scale tensors stay in higher precision, which is why the footprint shrinks by about 3.06× rather than a clean 4×. NVIDIA's published BF16-versus-NVFP4 comparison (measured on a GB300 configuration, table in the appendix) shows very small deltas, but those scores are NVIDIA's, measured on one configuration—they do not prove equality across every agent harness, language, prompt style, and GPU. For a coding agent, validate the workload you actually run: Russian/English coding, structured tool calls, your MCP tool set, and long multi-turn trajectories.
For this article's hardware, the choice is concrete. The RTX 5060 Ti is a Blackwell consumer card (compute capability 12.0) that cannot hold even the FP8 weights in VRAM. The benchmark in the next section measures both the FP8 and NVFP4 checkpoints on this card. NVFP4's smaller weight footprint matters most on 16 GB—although at roughly 23 GB of weights it still exceeds VRAM, which is why FreeToken's MoE offload remains necessary in both cases. The NVFP4 model card officially targets vLLM with --quantization modelopt; this test shows FreeToken can serve it as well on a Blackwell consumer card.
Statistical benchmark: FP8 vs NVFP4
Both quantizations were measured with the same three-iteration statistical method as the earlier RTX 4090 article, on the same desktop, with the same FreeToken operating profile (--moe-backend offload, --kv-reserve-tokens 260000, --max-running-requests 2, --cuda-graph-max-bs 2). The server processed one request at a time. Each response was capped at 200 output tokens. Values below are client-observed generation throughput, not kernel-only GPU decode measurements.
The headline result, before the tables: on the stable subset (15 of 17 categories), NVFP4 averaged 49.0 tok/s vs 19.8 tok/s for FP8 — roughly 2.5× faster — with 100% request success on both. The two excluded categories (233K full-context and 17.5K multi-module) had high run-to-run variance from warm/cold effects; they are shown in full below and discussed in the caveats.
FP8 statistical results
The FP8 run covered 16 prompt categories, three iterations each (48 requests total).
| Prompt category | Prompt tokens | Mean generation tok/s | 95% CI | CV | Success |
|---|---|---|---|---|---|
| Extra-long code review, multi-module | 17,515 | 22.2 | [17.8, 26.7] | 12.4% | 3/3 |
| Long full-project task queue | 713 | 25.7 | [24.7, 26.6] | 2.3% | 3/3 |
| Long analysis, remote work | 674 | 22.9 | [22.7, 23.1] | 0.6% | 3/3 |
| Long summarize, expedition journal | 620 | 22.8 | [20.5, 25.1] | 6.2% | 3/3 |
| Long architecture, ridesharing | 634 | 19.0 | [16.9, 21.2] | 7.1% | 3/3 |
| Long debug, connection-pool leak | 1,158 | 18.6 | [14.8, 22.4] | 12.8% | 3/3 |
| Medium architecture, notification system | 107 | 20.9 | [19.9, 21.9] | 2.9% | 3/3 |
| Medium debug, race condition | 147 | 19.7 | [18.9, 20.5] | 2.6% | 3/3 |
| Medium algorithm, binary search | 86 | 18.7 | [18.5, 19.0] | 0.9% | 3/3 |
| Medium explain, consistent hashing | 101 | 18.8 | [18.7, 18.9] | 0.3% | 3/3 |
| Short architecture | 6 | 22.5 | [20.8, 24.2] | 4.7% | 3/3 |
| Short debug, off-by-one | 23 | 18.6 | [18.1, 19.2] | 1.7% | 3/3 |
| Short greeting | 1 | 17.7 | [17.0, 18.4] | 2.6% | 3/3 |
| Short greeting variant | 6 | 19.6 | [19.0, 20.2] | 1.9% | 3/3 |
| Short greeting variant 2 | 6 | 17.0 | [15.8, 18.2] | 4.4% | 3/3 |
| Short math | 8 | 15.2 | [13.7, 16.6] | 6.0% | 3/3 |
All 48 of 48 requests succeeded. Every category remained below the benchmark's 20% coefficient-of-variation threshold, with no outliers beyond two standard deviations. The measured range was approximately 15–26 tok/s.
NVFP4 statistical results (all categories)
The NVFP4 run used the full prompt set of 17 categories with three iterations per prompt (51 total requests), adding a 233K-token full-context category.
- Request success: 51/51 (100%).
- Statistically stable categories (
CV < 20%): 15/17.
| Prompt category | Prompt tokens | Mean generation tok/s | 95% CI | CV | Success |
|---|---|---|---|---|---|
| Extra-long code review, full context | 233,426 | 19.9 | [-5.3, 45.2] | 79.0% | 3/3 |
| Extra-long code review, multi-module | 17,515 | 40.9 | [17.7, 64.1] | 35.3% | 3/3 |
| Long debug, connection-pool leak | 1,158 | 50.0 | [49.8, 50.2] | 0.3% | 3/3 |
| Long full-project task queue | 713 | 50.6 | [44.2, 56.9] | 7.8% | 3/3 |
| Long analysis, remote work | 674 | 45.8 | [41.4, 50.1] | 5.9% | 3/3 |
| Long architecture, ridesharing | 634 | 53.7 | [52.6, 54.9] | 1.3% | 3/3 |
| Long summarize, expedition journal | 620 | 48.3 | [48.1, 48.6] | 0.3% | 3/3 |
| Medium debug, race condition | 147 | 49.3 | [47.8, 50.8] | 1.9% | 3/3 |
| Medium architecture, notification system | 107 | 56.2 | [55.0, 57.3] | 1.3% | 3/3 |
| Medium explain, consistent hashing | 101 | 51.4 | [50.9, 51.9] | 0.6% | 3/3 |
| Medium algorithm, binary search | 86 | 50.7 | [50.2, 51.2] | 0.6% | 3/3 |
| Short debug, off-by-one | 23 | 46.3 | [43.8, 48.8] | 3.4% | 3/3 |
| Short math | 8 | 36.2 | [35.5, 36.8] | 1.1% | 3/3 |
| Short architecture | 6 | 54.7 | [51.7, 57.7] | 3.4% | 3/3 |
| Short greeting variant | 6 | 48.0 | [47.2, 48.7] | 1.0% | 3/3 |
| Short greeting variant 2 | 6 | 45.7 | [45.7, 45.8] | 0.1% | 3/3 |
| Short greeting | 1 | 47.4 | [45.3, 49.5] | 2.7% | 3/3 |
Fair NVFP4 vs FP8 comparison (stable categories only)
To avoid over-weighting warm/cold outliers in very long prompts, a fair comparison was computed on the stable subset only (CV < 20%, no outliers).
| Prompt category | Prompt tokens | FP8 tok/s | NVFP4 tok/s | Delta tok/s | Delta % | FP8 resp s | NVFP4 resp s | Delta s |
|---|---|---|---|---|---|---|---|---|
| Long debug, connection-pool leak | 1,158 | 18.6 | 50.0 | +31.4 | +168.5% | 27.74 | 10.22 | -17.52 |
| Long full-project task queue | 713 | 25.7 | 50.6 | +24.9 | +96.9% | 19.91 | 10.15 | -9.76 |
| Long analysis, remote work | 674 | 22.9 | 45.8 | +22.9 | +100.1% | 22.33 | 11.19 | -11.14 |
| Long architecture, ridesharing | 634 | 19.0 | 53.7 | +34.7 | +182.3% | 26.93 | 9.51 | -17.42 |
| Long summarize, expedition journal | 620 | 22.8 | 48.3 | +25.5 | +112.0% | 22.46 | 10.57 | -11.90 |
| Medium debug, race condition | 147 | 19.7 | 49.3 | +29.6 | +150.3% | 25.97 | 10.37 | -15.59 |
| Medium architecture, notification system | 107 | 20.9 | 56.2 | +35.3 | +168.8% | 24.48 | 9.10 | -15.38 |
| Medium explain, consistent hashing | 101 | 18.8 | 51.4 | +32.6 | +173.8% | 27.23 | 9.94 | -17.28 |
| Medium algorithm, binary search | 86 | 18.7 | 50.7 | +32.0 | +170.6% | 27.28 | 10.08 | -17.20 |
| Short debug, off-by-one | 23 | 18.6 | 46.3 | +27.6 | +148.2% | 27.41 | 11.05 | -16.36 |
| Short math | 8 | 15.2 | 36.2 | +21.0 | +138.1% | 12.23 | 5.01 | -7.21 |
| Short architecture | 6 | 22.5 | 54.7 | +32.3 | +143.5% | 22.77 | 9.34 | -13.43 |
| Short greeting variant | 6 | 19.6 | 48.0 | +28.4 | +144.7% | 17.18 | 6.88 | -10.30 |
| Short greeting variant 2 | 6 | 17.0 | 45.7 | +28.7 | +169.1% | 15.84 | 6.64 | -9.20 |
| Short greeting | 1 | 17.7 | 47.4 | +29.7 | +168.0% | 15.91 | 7.12 | -8.80 |
Stable-set aggregate (15 categories):
- Mean FP8 throughput: 19.8 tok/s.
- Mean NVFP4 throughput: 49.0 tok/s.
- Mean delta: +29.1 tok/s (+146.6%).
Interpretation caveats:
- The 233K full-context prompt had one very slow cold run followed by two much faster warm runs; this makes its CV high even though all runs succeeded.
- The 17.5K multi-module prompt showed a similar warm/cold split, and is therefore excluded from the fair subset.
- For cross-quantization claims, the stable-subset comparison is more reliable than a naive average over all rows.
What the numbers mean
NVFP4 is roughly 2.5× faster than FP8 on the stable subset (49.0 vs 19.8 tok/s mean), with the same 100% request success. The FP8 range was 15–26 tok/s; NVFP4 spans roughly 36–56 tok/s on stable categories. Both are lower than the earlier 24.5 GiB RTX 4090 deployment, as expected: this GPU has less VRAM for expert caching and therefore pays more frequent cache-miss costs, and it has a lower practical concurrency limit.
For the intended use case, the key row is the 17,515-token multi-module code-review prompt: FP8 completed it at 22.2 tok/s, NVFP4 at 40.9 tok/s. Both would have been rejected immediately under the default 8,330-token effective KV limit.
Concurrency: two is the safe limit
The 24.5 GiB RTX 4090 deployment could usefully batch eight requests. This 16 GB desktop cannot provide the same headroom after accounting for the desktop session, required KV reservation, expert cache, activation memory, CUDA graphs, and safety margin.
At the validated configuration:
--cuda-graph-max-bs 2 \
--max-running-requests 2 \
--kv-reserve-tokens 260000
A direct comparison used a 174-token debug prompt with a 200-token output budget:
| Concurrency | Wall time | Aggregate throughput |
|---|---|---|
| 1 sequential request | 9.06 s | About 22.0 tok/s |
| 2 concurrent requests | 16.69 s | About 23.8 tok/s |
Doubling the active requests produced an approximately 8% aggregate throughput gain. This is real, but modest. It is not a configuration where adding more concurrency produces linear scaling.
A separate 300K KV configuration showed why pushing beyond this point was unsafe: raising concurrency from two to four reduced the MoE expert cache sharply and left the process close to the runtime allocation boundary. It was not treated as a valid long-context production setting.
The appropriate conclusion is not that this GPU “supports four requests because the server starts.” The appropriate conclusion is that two concurrent requests are the validated safe operating point for this desktop, this model, and this long-context goal.
Comparison with 24 GB RTX 4090
| Dimension | RTX 4090, 24.5 GiB | RTX 5060 Ti, 16.3 GiB |
|---|---|---|
| Default effective KV floor | 8,255 tokens | 8,330 tokens |
| Selected KV reservation | 300,000 tokens | 260,000 tokens |
| MoE cache at selected setting | 2,966 pages | 1,273 pages |
| Longest verified prompt | 60,028 tokens | 92,436 tokens |
| Statistical single-request range | About 21–48 tok/s | About 15–26 tok/s (FP8); about 36–56 tok/s (NVFP4) |
| Validated concurrency target | 8 requests, about 114 aggregate tok/s | 2 requests, about 23.8 aggregate tok/s |
| Long-context failure observed | None in the tested profile | CUDA OOM with 120K KV reservation; sustained-serving OOM at 260K (see correctness eval) |
| Qualbench correctness run (FP8) | 46/50, 0 real avoidable failures, no restart | 48/50, 0 real avoidable failures, one restart (see correctness eval) |
In FP8, the 16 GB card is clearly slower and supports less useful concurrency. With NVFP4, its single-request throughput (about 36–56 tok/s) lands in the same range as the 4090's FP8 measurements (about 21–48 tok/s)—the smaller card's real limitations are concurrency and memory margin, not raw generation speed. The long-context result should not be interpreted as general superiority over the 4090; the two deployments validated different maximum prompt sizes rather than executing an identical full-limit test.
The meaningful shared result is architectural: both GPUs started with an approximately 8K effective context despite the model advertising 262K, and both needed explicit KV-cache planning to become useful for long-context work. The smaller card demonstrates that large usable context remains possible on 16 GB VRAM, but its safety margin and concurrency envelope are much tighter.
Correctness: a 50-task quality eval
The benchmark above answers a speed question: on this GPU, NVFP4 generates roughly 2.5× faster than FP8 across the stable prompt set. It does not answer a correctness question: does the smaller weight footprint change what the model actually gets right? Tokens per second are cheap to trust and expensive to be wrong about—a faster wrong answer is still wrong, and for a coding agent, silently regressed correctness is worse than a slower response, because it erodes trust in exactly the kind of low-stakes-looking task (a migration script, a small bugfix) where a human is least likely to double-check the output.
To measure that directly, both quantizations were run through qualbench, a 50-task, model-in-the-loop regression suite built specifically for this comparison, part of the llm-tests repository. Every task sends a fixed prompt to the live server and grades the response with a deterministic check—a real compiler/test runner, a schema validator, or a regex against required phrasing—rather than an LLM-judge. The suite spans six categories:
| Category | Tasks | What it checks |
|---|---|---|
| Java/Spring bugfix | 10 | Planted bug in a class; fix must make the existing JUnit suite pass (mvn test) |
| TypeScript/Angular bugfix | 8 | Planted bug in a component/service; fix must make the existing spec pass (vitest) |
| SQL migrations | 6 | Planted bug in a Postgres migration; fix must apply cleanly and, where required, be idempotent on a second run |
| MCP/tool-call | 8 | Given a tool schema and a request, the model must emit the correct call—or correctly emit none |
| Security review | 8 | Planted vulnerability (SQL injection, SSRF, hardcoded secret, etc.); model must name the issue, graded by regex recall |
| Long-context retrieval | 10 | Needle-in-haystack retrieval at 8K/64K/150K tokens and three needle positions, including two decoy-marker tasks |
Both quantizations used the same ft serve flags as the throughput benchmark above (--moe-backend offload --cuda-graph-max-bs 2 --max-running-requests 2 --kv-reserve-tokens 260000). Every single-task failure was re-run two to three additional times before being logged as a finding, specifically to separate genuine model behavior from the temperature-0 non-determinism this offloaded-MoE setup already exhibits. The mechanism: with experts fetched from host RAM on cache miss, the exact set of experts resident in VRAM at any moment depends on prior traffic, so identical prompts can route through slightly different effective weights and produce different outputs — the same batching/expert-routing effects that widen a throughput confidence interval can also flip an individual task's pass/fail on a rerun.
Results: FP8 48/50, NVFP4 46/50
| FP8 | NVFP4 | |
|---|---|---|
| Pass rate | 48/50 | 46/50 |
| Real, avoidable failures (excluding by-design and already-shared issues) | 0 | 1 |
| Total suite wall time | ~77 min (one server restart) | ~41 min (no restart) |
The FP8 restart was not incidental: at this exact 260K KV configuration, the server hit a genuine CUDA out-of-memory error partway through the long-context category, after already having served the other five categories back-to-back (~47 minutes of continuous prior traffic). This is the same memory-margin issue quantified in "Real memory footprint" above — peak long-context VRAM usage (~15.6–15.7 GiB) leaves almost no headroom on this 16.3 GiB card. Restarting the server and running long-context first, on a freshly loaded process, resolved it cleanly (10/10 pass) with no further crashes; the NVFP4 run applied that lesson from the start and needed no restart. Treat this as an operational constraint of sustained serving at this KV reservation on this hardware, not a quantization difference — it reproduced identically on both formats when tested under matching conditions.
Of the four total non-passes across both quantizations, three are not meaningful findings:
- One MCP task on each quantization is an intentional hallucination probe (a request with deliberately incomplete information)—it is designed to fail every run and was scored that way on both FP8 and NVFP4, not as a regression.
- One SQL task on each quantization reproduces the same defect at a comparable rate on both: the model occasionally emits
ALTER TABLE ... ADD CONSTRAINT IF NOT EXISTS ..., which is not valid Postgres syntax (IF NOT EXISTSonly applies toCREATE INDEX/CREATE TABLE/ADD COLUMN, notADD CONSTRAINT). This looks like a training-data-level overgeneralization in the base model, not something either quantization introduces or fixes.
Exactly one failure is a genuine, quantization-specific regression. A different SQL migration task asks the model to make a script idempotent—safe to run twice. FP8 fails here rarely (about one run in three, across one batch) via a reasoning-loop failure mode: the model gets stuck re-deriving and re-rejecting the same hypothesis and never emits a final answer, while other runs pass cleanly with a fully correct fix. NVFP4 fails here consistently—four times out of four, across the original run and three dedicated reruns—via a specific, repeatable omission: it correctly adds an idempotency guard to every later statement (the CREATE INDEX, the CREATE TABLE, the seed INSERT) but leaves the very first statement, ALTER TABLE accounts ADD COLUMN is_active ..., unguarded, so the second run of the migration fails immediately on that first line.
This is the clearest signal in the whole suite that NVFP4's smaller weight footprint is not a free lunch on every task. It is a narrow, specific finding—one task out of fifty—not a general claim that NVFP4 is less capable. Everything else NVFP4 got right, it got right just as reliably as FP8, at roughly half the wall time.
Confirmation run on the 24 GB RTX 4090
The same 50-task suite was later run against the larger RTX 4090 deployment (192.168.0.88, FP8, froggeric v22.4 template, --kv-reserve-tokens 300000) as a cross-hardware confirmation. Result: 46/50, with 0 real avoidable failures — every non-pass matched a finding already documented on the 5060 Ti (the same three known model-family patterns: java-spring task 09 and ts-angular task 03 non-determinism, sql-migrations task 05's ADD CONSTRAINT IF NOT EXISTS hallucination, plus the by-design MCP probe). No new findings appeared on the larger card.
Two details stand out:
- SQL task 04 passed on the 4090. This is the task that is a reproducible NVFP4-specific regression on the 5060 Ti (4/4 fail) and a rare FP8 reasoning-loop failure there (~1/3). Passing here is consistent with FP8's documented occasional-failure behavior; it does not change the NVFP4-specific finding.
- No OOM, no restart. The 4090's 24.5 GiB VRAM absorbed the sustained-serving memory pressure that crashed the 16 GB card mid-suite. Long-context passed 10/10 including both 150K-token tasks, in the same continuous session as the other five categories. This is the practical payoff of the memory-margin analysis above: the same workload that needs careful session management on 16 GB runs unattended on 24 GB.
The confirmation run also surfaced a harness gotcha worth knowing if you reproduce this suite: the long-context category imports tiktoken (via its prompt generator), so the harness must be run with the repo's venv python rather than the system python, or that category silently runs 0/0 tasks.
What this changes about the recommendation
The throughput comparison earlier in this article already favored NVFP4 by a wide margin on this hardware. This correctness pass does not overturn that—46/50 with one narrow, identified regression is still a strong result—but it does sharpen the recommendation: NVFP4 is the better default for this hardware, provided idempotent-migration-style tasks are either avoided, reviewed, or reinforced with a stronger system prompt (e.g., explicitly instructing the model to guard every statement in a multi-statement script, not just the ones it independently judges to need it). For workloads that do not touch that specific pattern—which is most of the suite—NVFP4 showed no observed correctness cost for a roughly 2.5× throughput gain.
The broader lesson generalizes past this one model and this one card: a quantization comparison that only measures tokens per second is an incomplete comparison for a coding agent. The two questions—is it fast enough to accept the context this task needs (the subject of the rest of this article) and does it still get the task right once that context is accepted—are independent, and both need a real answer before a quantization choice can be called validated rather than merely fast.
Launch command
The following command was used for the validated 92K-context and benchmark configuration. The two weight formats differ only in the model path and the log file:
source ~/freetoken/.venv/bin/activate
export PATH=/usr/local/cuda/bin:$PATH

# FP8
nohup ft serve \
  --model-path ~/llm_models/Qwen3.6-35B-A3B-FP8 \
  --moe-backend offload \
  --served-model-name qwen3.6-35b-a3b \
  --host 127.0.0.1 \
  --port 8000 \
  --cuda-graph-max-bs 2 \
  --max-running-requests 2 \
  --kv-reserve-tokens 260000 \
  > ~/qwen36_35b_serve.log 2>&1 & disown

# NVFP4: identical flags, only the model path and log file change
nohup ft serve \
  --model-path ~/llm_models/Qwen3.6-35B-A3B-NVFP4 \
  --moe-backend offload \
  --served-model-name qwen3.6-35b-a3b \
  --host 127.0.0.1 \
  --port 8000 \
  --cuda-graph-max-bs 2 \
  --max-running-requests 2 \
  --kv-reserve-tokens 260000 \
  > ~/qwen36_35b_nvfp4_serve.log 2>&1 & disown
At steady state, the process used roughly 14.75 GiB of 16.3 GiB VRAM for both formats (idle ~14.7 GiB; long-context peaks ~15.6–15.7 GiB). The runtime reported around 1.1 GiB of headroom at the observed planning stage, but actual safe headroom varies with CUDA graph capture, temporary allocations, and the request profile. The host expert-weight pool consumed about 31.4 GiB of RAM for FP8 and 21.8 GiB for NVFP4.
Because this server is bound to 127.0.0.1, it is intentionally local-only. To serve LAN clients directly, use --host 0.0.0.0 and apply normal network controls such as a firewall rule, reverse proxy, authentication layer, or a private network overlay. Do not expose an unauthenticated local model endpoint directly to the public Internet.
Reproducibility notes
Record the full software and hardware state with every benchmark:
ft --version
python --version
uv pip freeze | grep -Ei 'freetoken|torch|triton|tvm'
nvidia-smi
nvcc --version
git -C ~/freetoken rev-parse HEAD 2>/dev/null || true
Check PCIe state while inference is active:
watch -n 1 \
'nvidia-smi --query-gpu=timestamp,name,utilization.gpu,memory.used,pcie.link.gen.current,pcie.link.width.current --format=csv,noheader'
Keep detailed link information from lspci as well:
lspci -vv | grep -A22 -Ei 'NVIDIA|VGA|3D'
Also validate the largest expected prompt after every material configuration change. Changing --kv-reserve-tokens, --max-running-requests, --cuda-graph-max-bs, model format, FreeToken version, NVIDIA driver, or desktop GPU usage can move the safe runtime boundary.
Appendix: format reference tables
Full format comparison
| Criterion | BF16 | FP8 | NVFP4 |
|---|---|---|---|
| Weight format | BF16 | Fine-grained FP8, 128-element blocks | NVIDIA NVFP4 via Model Optimizer |
| Source | Qwen | Qwen | NVIDIA, quantized from the Qwen checkpoint |
| Claimed quality loss | Reference | “Nearly identical” to the original | Small, backed by comparative eval |
| Approximate weight footprint | ~70–72 GB for the 35B weights alone | ~35–36 GB for the weights | ~3.06× smaller than BF16; roughly ~23 GB for the quantized part plus unquantized tensors and overhead |
| Context | 262,144 native; ~1.01M with YaRN | Same | Up to 262K per the NVIDIA card |
| Modalities | Text, image, video → text | Same | Same |
| Officially stated runtimes | Transformers, vLLM, SGLang, KTransformers | Transformers, vLLM, SGLang, KTransformers | vLLM with --quantization modelopt |
| Hardware portability | Widest, but memory-hungry | Requires practical FP8 support in the stack and GPU | Explicitly Hopper/Blackwell; an NVIDIA-specific path |
| Best-fit scenario | Reference, compatibility, fine-tuning, research | Production serving on FP8-capable GPUs | Maximum VRAM savings, high-density serving |
| Main risk | Impractical on a single 48 GB GPU once KV cache is budgeted | On older GPUs, FP8 may not accelerate or may need fallback paths | Less portability; runtime and kernel compatibility matter more than for FP8/BF16 |
NVIDIA's published BF16 vs NVFP4 quality deltas (GB300)
| Benchmark | BF16 | NVFP4 | Delta |
|---|---|---|---|
| MMLU Pro (massive multitask language understanding) | 85.6 | 85.0 | −0.6 |
| GPQA Diamond (graduate-level science questions) | 84.9 | 84.8 | −0.1 |
| τ²-Bench Telecom (agentic tool-use benchmark) | 95.5 | 94.7 | −0.8 |
| SciCode (scientific coding) | 40.8 | 40.6 | −0.2 |
| AIME 2025 (math olympiad) | 89.2 | 88.8 | −0.4 |
| AA-LCR (long-context recall) | 62.0 | 62.0 | 0.0 |
| IFBench (instruction following) | 62.3 | 62.8 | +0.5 |
| MMMU Pro (multimodal understanding) | 74.1 | 74.5 | +0.4 |
Which format for which job
| Task | Recommended format | Why |
|---|---|---|
| Reference run, research, custom quantization | BF16 | Fewest variables and widest compatibility |
| Main local or production endpoint on a modern NVIDIA GPU | FP8 | Official Qwen format, near-original quality, good portability |
| Hopper/Blackwell, VRAM-critical, maximum density | NVFP4 | Much smaller weight footprint with a small measured quality delta |
| Single RTX 4090/5090 or 48 GB-class GPU | FP8 with a realistic max-model-len; NVFP4 if the hardware/runtime supports it | Full 262K and comfortable batching still hit the KV-cache wall |
| SGLang, KTransformers, or CPU–GPU offload stacks | FP8 or BF16 | The NVFP4 card officially names vLLM only |
| Agent with 128K+ context and many parallel sessions | FP8/NVFP4 plus a separate KV budget | Weight quantization is only one part of the VRAM budget |
A rule of thumb that avoids most mistakes: FP8 is the default; NVFP4 is a targeted optimization for recent NVIDIA silicon; BF16 is the reference and research/compatibility option.
Lessons
- The default KV-cache floor is not a usable long-context configuration. This 262K-capable model started with an effective limit of only 8,330 tokens and rejected a 24,028-token request.
- System RAM makes the oversized checkpoint runnable; VRAM policy makes the server useful. Host RAM held the large expert pool, while the 16 GB GPU had to balance expert-cache capacity against the KV cache required for long context.
- A 16 GB GPU can be a credible long-context coding node. With explicit KV planning, this desktop successfully processed a 92,436-token prompt and a 17,515-token multi-module code review.
- Tune for the longest expected request, not the fastest short benchmark. The 120K KV reservation looked better on short prompts but failed with CUDA OOM on the 92K test. A server that cannot safely handle its target input size is not production-ready.
- Context capacity should usually outrank a modest tok/s gain for coding. A 20–30% generation-speed improvement does not compensate for rejecting, truncating, or crashing on the files and diagnostic material needed for the task.
- Large context complements retrieval rather than replacing it. Select relevant files and evidence with search, code intelligence, and tests; then use the large context window to retain those materials across a longer agent session.
- Concurrency shrinks sharply on a smaller VRAM budget. Two requests were the validated safe operating point. The modest gain from batching did not justify giving up long-context margin for more speculative concurrency.
- A throughput win is not a correctness guarantee. NVFP4 generated roughly 2.5× faster than FP8 on this hardware, but a 50-task correctness eval found one narrow, reproducible regression—a SQL idempotency-guard omission—that the speed numbers alone would never surface. Validate quantization choices on both axes, not just tok/s.
For a local coding assistant, the right question is not simply “How many tokens per second can this GPU generate?” It is “Can the server reliably keep enough code, tests, logs, constraints, and agent history in context to solve the task—and still get that task right?” On this 16 GB RTX 5060 Ti, FreeToken makes the answer yes—provided that KV cache is planned first, throughput is optimized only within the remaining safe memory budget, and any quantization shortcut is checked against real task outcomes, not just speed.
Resources
- Qwen/Qwen3.6-35B-A3B (BF16): https://huggingface.co/Qwen/Qwen3.6-35B-A3B
- Qwen/Qwen3.6-35B-A3B-FP8: https://huggingface.co/Qwen/Qwen3.6-35B-A3B-FP8
- nvidia/Qwen3.6-35B-A3B-NVFP4: https://huggingface.co/nvidia/Qwen3.6-35B-A3B-NVFP4
- llm-tests (qualbench suite): https://github.com/berdachuk/llm-tests
Published on 9/3/2026