Testing Qwen3.6-35B-A3B Vision Locally: MMMU Results on an RTX 4090 vs the Published Benchmarks
My self-hosted Qwen3.6-35B-A3B server has been handling text workloads for weeks: coding agents, code review, a 50-task text benchmark. The model card says the same checkpoint also carries a vision encoder for images, charts, documents, and video. I had no local check for that claim, so "vision enabled" was unverified.
I built a small vision eval, ran it against the local endpoint, and compared the results with the numbers Qwen publishes on Hugging Face.
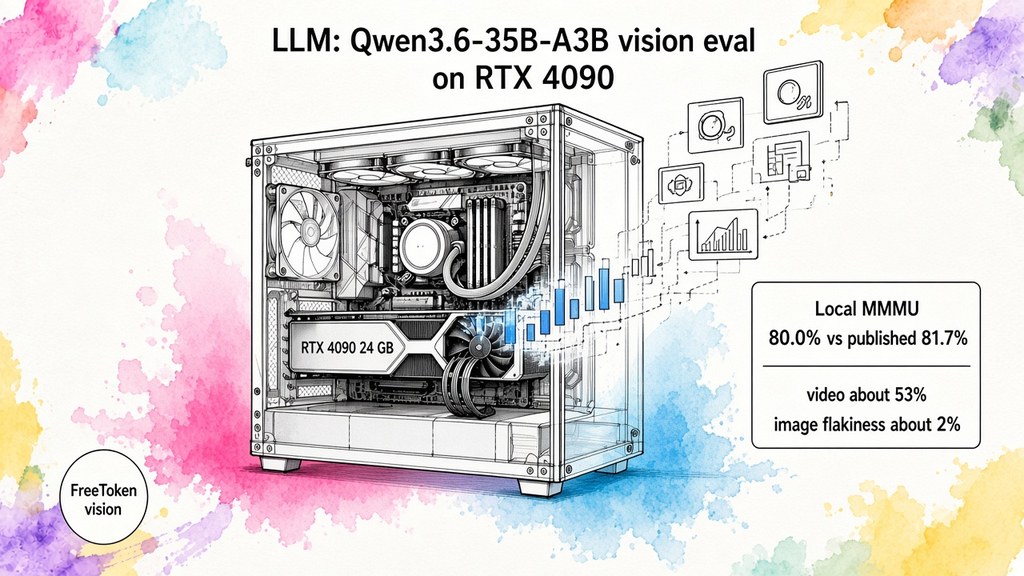
The local setup scores 80.0% on a 60-item MMMU subset against a published MMMU score of 81.7%. Those two numbers look close, but they are not the same measurement, for reasons listed below.
What the headline skips is more useful: a token-budget trap that faked a 22-point accuracy drop, a grading bug that inflated scores, a fixture bug in my own eval, and a per-domain split where screenshots are easy and photographs are hard.
The setup
The server is unchanged from the text setup in the OpenCode + FreeToken article: a FreeToken inference server on an RTX 4090 (24.5 GiB) at http://192.168.0.88:8000/v1, serving Qwen3.6-35B-A3B-FP8 with a 262,144-token context.
Enabling vision changed two launch flags on the serving engine. Details are in the next section. Two facts matter for trust:
- The full 50-task text benchmark re-ran immediately after enabling vision: 47/50, identical to the text-only baseline, with the advertised context length still at 262,144 and no OOM or restart. Enabling vision did not degrade the text path.
- A separate smoke test confirmed the OpenAI-compatible image path (
image_urlwith base64 data URLs) works end-to-end before any eval existed.
The FreeToken configuration that activates vision
Vision support is not a download or a config-file change. It depends on which launch flags the serving engine gets. The server runs FreeToken v0.1.3 as a systemd user unit that starts the engine with the model path and a flag list. Activating multimodal support was a two-flag change to that unit. Effective command line after the change:
ft daemon start /mnt/data/berda-models/models/Qwen3.6-35B-A3B-FP8 -- \
  --moe-strategy offload \
  --allowed-local-media-path /mnt/data/qualbench-mm \
  --served-model-name qwen3.6-35b-a3b \
  --host 0.0.0.0 --port 8000 \
  --cuda-graph-max-bs 4 --max-running-requests 4 \
  --kv-reserve-tokens 300000 \
  --num-tokenizer 0 \
  --tool-call-parser qwen3_coder --reasoning-parser qwen3
The two vision-relevant flags:
| Flag | Role | Notes |
|---|---|---|
(absent) --text-model-only | The switch itself | In v0.1.3 a multimodal checkpoint builds its vision tower by default once this flag is absent. No new weights were needed: the checkpoint ships vision_config and 333 model.visual.* tensors, previously skipped by the loader. Measured cost: +472 MiB VRAM (23,158,849,536 -> 23,653,777,408 bytes resident) on a card that had under 1 GiB free, which is why the flag existed. |
--allowed-local-media-path /mnt/data/qualbench-mm | Optional allowlist for file:// media refs | Requests may reference images as file://... only from this one directory; everything else stays rejected by default. It exists for test harnesses running directly on the node. This article's eval does not use it. It sends base64 data URLs over the network, so the eval client and the GPU server need no shared filesystem. |
Everything else on that command line is unchanged from the text-only setup. Each flag exists for a reason if you copy the config:
| Flag | Why it is there |
|---|---|
--moe-strategy offload | MoE experts stream from host RAM into a GPU expert cache; a 35B checkpoint does not fit 24 GiB otherwise. (Renamed from --moe-backend in 0.1.3; the old spelling is a deprecated alias.) |
--kv-reserve-tokens 300000 | KV floor claimed before the expert cache fills the rest. Vision profiling consumed ~472 MiB of that headroom. If free VRAM regresses on a future upgrade, lower this knob first; reinstating --text-model-only is the last resort because it disables vision for every consumer. |
--tool-call-parser qwen3_coder / --reasoning-parser qwen3 | Required by coding-agent clients; the reasoning parser splits chain-of-thought into reasoning_content. Relevant to this article's truncation findings: reasoning tokens consume max_tokens, so a small output budget can end with finish_reason=length and an empty content. |
--served-model-name qwen3.6-35b-a3b | The model ID every client hardcodes; changing it breaks all consumers at once. |
--host 0.0.0.0 --port 8000 | LAN API on :8000; the public entry is a Bearer-gated TLS gateway in front of it. |
Check the serve log after (re)starting the engine. Confirm the vision tower is actually resident:
# in the serve log (~/.local/state/freetoken/logs/):
# Multimodal enabled: QwenVLMMProcessor, encoders ['vision'] on host, serving ['image']

ft ctl --base-url http://127.0.0.1:8000 stats   # expect ~23.6e9 vram_bytes
Two operational warnings learned the hard way, both inherited from the text setup but sharper with vision loaded:
/v1/modelsanswers ~3 s after start while weights are still loading; it is not a readiness signal. Wait forAPI server is readyin the serve log and watchnvidia-smireach ~22 GiB.- The VRAM headroom after load is thin (~1.9 GiB). Treat any future engine upgrade or restart as a potential vision-vs-KV regression: re-check
nvidia-smiandft ctl stats, then re-run the eval.
Building a small, honest vision eval
Published vision benchmarks use their own harness, prompts, and answer parsers. To compare local serving against published numbers, I needed an eval I could defend, so I built one instead of trusting a single cherry-picked prompt.
The eval lives as an opt-in category in the qualbench suite. Design decisions that matter:
| Decision | What was done | Why |
|---|---|---|
| Item source | 60 real items from the MMMU validation split, stratified across 4 visual domains (charts 16, photos 16, diagrams 16, screen-captures 12), fixed sampling seed | Real exam-style multimodal questions, spread across modalities instead of one favorite |
| Second suite | 16 synthetic items (OCR, counting, spatial, charts) with ground truth known by construction | Verifies wiring first; a failure there is a plumbing bug, not a model property |
| Video suite | 15 questions from 5 staged Video-MME clips (short, medium, one 52.8-minute long), 8 sampled frames each | Exercises the video path on real clips, where the model sees frames, not audio or subtitles |
| Transport | Images sent as base64 data URLs, never file:// | The eval client need not share a filesystem with the GPU server; the same harness runs in a container |
| Grading | Exact / normalized / numeric levels; the gap between them is reported as formatting slack | Reasoning quality and formatting variance are different signals |
| Failure taxonomy | Truncated generations, transport errors, and missing media are plumbing failures, never scored as wrong answers | The single most important rule (see the next section) |
| Sampling | temperature=0, reasoning effort low | Repeatability over peak benchmark scores |
| Media | Manifests (item definitions) committed to git; the images themselves stay outside git, located via an environment variable | MMMU images are gigabytes and license-restricted; the manifests define exactly what was evaluated |
One "task" in this harness is a visual-domain bucket aggregating many images, so each domain reports an accuracy over 12-16 items rather than a single pass/fail.
The lesson that mattered most: the token budget is part of the score
The first run scored 58.3%. The final runs score 80.0% and 78.3%. The model did not change. The token budget did.
This was the biggest confound of the whole exercise. Real MMMU charts and diagrams are dense: the model needs thousands of tokens of visible reasoning to read the image and work through the question. I started the eval with a text-era output budget (1,024-2,048 tokens), and the model was cut off mid-analysis on a third of the items, then scored wrong for reasoning the harness refused to let it finish.
| Run | max_tokens | Accuracy | Truncated | Genuine wrong answers |
|---|---|---|---|---|
| 1 | 1024->2048 | 35/60 = 58.3% | 21 | 4 |
| 2 | 4096 | 40/60 = 66.7% | 12 | 8 |
| 3 | 16384 | 48/60 = 80.0% | 4 | 8 |
| 4 (repeat of 3) | 16384 | 47/60 = 78.3% | 3 | 10 |
Two details make this table worth reading carefully:
- Accuracy over answered items stayed high across every budget (89.7% -> 83.3% -> 85.7% -> 82.5%). Raising the budget uncovered real capability; it did not inflate the score. Direct evidence: four items that truncated at the smaller budgets were re-run at 16384, and three of them flipped to correct, consuming 9,390-10,421 completion tokens each. One item alone used 15,900 tokens.
- The 21.7-point "spread" between runs 1-3 is not model variance. Those runs used different budgets. The eval tooling now embeds run configuration in the results file and refuses to present cross-config differences as model variance.
This also matches Qwen's own guidance. The model card recommends an output length of 32,768 tokens for most queries (81,920 for hard math/programming). My curve still gained 13 points between 4,096 and 16,384, which is what that recommendation predicts for a vision-reasoning workload. If your own eval truncates heavily, the accuracy number is about your harness, not the model.
A handful of items still truncate even at 16,384 (four in run 3, three in run 4, a different set), each burning 300-500 seconds in a genuine reasoning loop. They are counted as plumbing failures, excluded from flakiness math, and reported rather than hidden.
Results by visual domain
At the correct budget, both clean runs agree on the ordering:
| Domain | Run 3 | Run 4 | Threshold | Verdict |
|---|---|---|---|---|
| screen-captures | 11/12 = 91.7% | 11/12 = 91.7% | 50% | PASS |
| charts | 14/16 = 87.5% | 15/16 = 93.8% | 50% | PASS |
| diagrams | 12/16 = 75.0% | 11/16 = 68.8% | 40% | PASS |
| photos | 11/16 = 68.8% | 10/16 = 62.5% | 60% | PASS |
| total | 48/60 = 80.0% | 47/60 = 78.3% |
Context for the raw numbers:
- The random-chance floor for this item mix is 26.0% (four-option multiple choice), so the lift over guessing is roughly 52-54 points. The score carries real signal.
- Domain spread is wide: about 23-31 points between the best and worst bucket. A headline "80%" hides a modality the model is materially weaker at.
- Photos is the weakest bucket in both clean runs (agricultural photos, histology, geography). With 16 items per bucket, a single flipped item moves a bucket by 6.25 points, so treat the domain gaps as directional, not exact.
- Screen-captures (92%) line up with the model's published strength on document and UI text: OmniDocBench 89.9 and CC-OCR 81.9 on the model card point the same way.
On the synthetic smoke suite (16 items, ground truth known by construction), the model scores 15/16 = 93.8%. The miss is a reasoning loop that truncates, not a wrong answer.
Run-to-run stability: ~2%
The first cross-run comparison looked bad: 7 of 60 items "flipped" their answers between two runs, suggesting 11.7% nondeterminism. Every one of them had an empty answer on one side. That is truncation, not a changed opinion.
Fixed methodology: any item that a run failed for plumbing reasons is excluded from the flakiness count and reported separately as unmeasurable. Re-running run 3 at the identical configuration (run 4) gives the clean measurement:
53 measurable items: 45 always correct, 7 always wrong, 1 flipped (1.9%)
accuracy spread: 80.0% vs 78.3% (1.7%)
About 2% flakiness is a strong number here. The text categories on this same FP8 build show 10-30% nondeterminism on long reasoning tasks. A vision answer here is one option letter, so there is little room for a reasoning loop to land somewhere different. Caveat: flakiness is measured only on items neither run truncated, so the highest-token items are the least covered by this claim.
Video results: 52.8% on the long clip, 21% flakiness
I extended the eval to video after the image runs. Five Video-MME clips were staged (three short clips at 74-118s, one 7-minute medium clip, one 52.8-minute long clip = 158 MB total), producing 15 questions from the official annotations. The harness extracts 8 frames per clip via ffmpeg (uniformly spaced at frame midpoints) and sends them as base64 images to the model. No audio or subtitles are included.
Two runs at the same budget gave:
| Run | Accuracy | Truncated | Wall time |
|---|---|---|---|
| 1 | 8/15 = 53.3% | 1 (long clip) | 840s |
| 2 | 10/15 = 66.7% | 0 | 660s |
The threshold for the video bucket is 40% (the lowest among all buckets), so both runs pass. The spread between runs is 13.3 percentage points, far wider than the 1.7% image spread. The cross-run variance report attributes this to 3 flipped items out of 14 measurable items (21.4% flakiness):
| Item | Run 1 | Run 2 | Domain |
|---|---|---|---|
| video-01-002-1 (Christmas tree) | A (wrong) | C (correct) | Humanity & History |
| video-02-002-2 (Tomb excavation) | A (wrong) | D (correct) | Humanity & History |
| video-08-601-2 (Whitehead flight) | D (correct) | C (wrong) | Humanity & History |
Four items are always wrong (05, 07, 10, 13), seven always correct. The four always-wrong items all involve factual recall about video content (e.g. "which type of dance", "how many ditches were found") that may depend on narration the silent frame path never receives.
This is not a Video-MME score. The official benchmark uses 900 clips with its own frame policy and often includes subtitles (the published Qwen3.6 number of 86.6 is the "with subtitles" row). I report this only to show the gap you should expect from a 5-clip, 8-frame, no-subtitles run. Frame timing is the main takeaway: different frame positions in the same video can expose different visual content, and for questions that need narration, the answer varies with which frames triggered a usable reasoning path.
Comparing local results with the published benchmarks
Qwen publishes a vision-language benchmark table on the Qwen3.6-35B-A3B-FP8 model card (linked in the Resources section). The relevant rows:
| Benchmark | Qwen3.6-35B-A3B (published) | Notes |
|---|---|---|
| MMMU | 81.7 | full validation split, official harness |
| MMMU-Pro | 75.3 | harder variant of the same suite |
| CharXiv (RQ) | 78.0 | chart reasoning |
| CC-OCR | 81.9 | OCR / document understanding |
| OmniDocBench 1.5 | 89.9 | document parsing |
| AI2D | 92.7 | diagram understanding |
| RealWorldQA | 85.3 | real-world photos |
| HallusionBench | 69.8 | visual illusion resistance |
Side by side, with the honest caveats
| Measurement | Local (this setup) | Published |
|---|---|---|
| MMMU, overall | 80.0% / 78.3% (two runs, n=60 subset) | 81.7% (full validation split, official harness) |
| Chart-style reasoning | charts bucket 87.5% / 93.8% (n=16) | CharXiv (RQ) 78.0 (different benchmark) |
| Documents / screens | screen-captures bucket 91.7% (n=12) | OmniDocBench 89.9, CC-OCR 81.9 (different benchmarks) |
| Real-world photos | photos bucket 68.8% / 62.5% (n=16) | RealWorldQA 85.3 (different benchmark) |
Treat this as a sanity check, not a leaderboard comparison. The numbers land in the same neighborhood: local FP8 serving with the vision tower enabled performs at roughly the published level, not dramatically below it. The comparisons above are directional:
- Different item sets. Published MMMU uses the full 900-item validation split; this eval uses a fixed 60-item stratified subset. With n=60, the 95% confidence interval on 80% is roughly +/-10 points. The published 81.7% sits comfortably inside it.
- Different prompts and parsers. Qwen's harness uses its own prompt format and the officially recommended multiple-choice output standardization; this eval uses its own prompt and a letter-extraction parser. Two evals of the same model can differ by several points from prompting alone.
- Different sampling. The published thinking-mode recommendations are
temperature=1.0, top_p=0.95; this eval rantemperature=0with low reasoning effort, choosing repeatability over peak score. - Different serving. Published numbers come from large-scale reference deployments; this is a single RTX 4090 with FP8 weights, vision encoder loaded, and MoE expert offload.
Two comparisons I would flag:
- The output-budget finding matches the vendor's advice. The model card recommends 32,768 output tokens for most queries. My truncation curve (accuracy still climbing 13 points between 4K and 16K) is independent local evidence for the same conclusion.
- The photos gap is worth watching. 62.5-68.8% on real photographs against an 85.3% published RealWorldQA score is the largest directional gap in the table. It may be subset noise, prompt sensitivity, or a real weakness on natural photographs versus structured images. With n=16 I cannot distinguish those, which is why I report it instead of hiding it.
Bugs the eval caught along the way
A DIY eval pays off the first time it catches something. Four real bugs surfaced during bring-up, each of which would have silently distorted results:
- Truncation mistaken for wrong answers. The original 58.3% was mostly this. Now truncations are classified as plumbing failures and reported separately.
- Hedged multiple-choice answers credited. A reply like "Both B and C" was scored correct because its first character matched the expected letter. Now detected and refused; this inflated accuracy before the fix.
- Ambiguous fixture ground truth. One synthetic chart had a genuine tie (two series both +10), but the fixture asserted a single right answer; the model's equally defensible answer was scored wrong. My bug, not the model's.
- Reporting ambiguity. A dashboard given several run files labeled them "runs aggregated" while its tables came only from the latest run. It now states which run supplies its tables and that earlier runs feed the stability section.
Every one of these was found because the eval separates wrong answers from plumbing failures and treats repeatability as a first-class metric. That is the argument for building even a small local eval: it turns "the model seems worse today" into a checkable question.
What this does not tell you
- Video is a small first signal, not a Video-MME score. Full details (two-run results, 21% flakiness, per-item breakdown) are in the "Video results" section. This eval's frame-only approach with 5 clips is not comparable to the official 900-clip benchmark with subtitles.
- The domain gaps carry wide error bars. 12-16 items per bucket is enough to detect a broken deployment, not to rank modalities to a decimal place.
- This is not the official MMMU harness. For a publishable MMMU number, run the full 900-item validation split with the official tooling. This eval answers the operational question: is my local vision serving working at roughly the expected level, and did a change regress it?
- One GPU, one quantization. Results apply to this FP8 checkpoint on FreeToken; other engines, quantizations, and sampling settings will shift the numbers.
Reproducing it
The eval is an opt-in category in the qualbench harness, with a containerized client documented step by step:
cd qualbench/fixtures/multimodal
export QUALBENCH_MM_MEDIA_ROOT=/mnt/data/qwen36-mm-eval/media
python3 check.py --all --suite mmmu-subset \
  --url http://192.168.0.88:8000 --model qwen3.6-35b-a3b \
  --timeout 900 --max-tokens 16384 \
  --emit-records --records-out results/mmmu.jsonl
python3 variance_report.py results/mmmu.jsonl
python3 dashboard.py results/mmmu.jsonl -o results/dashboard.md
For the video suite, fetch a few clips by ID and build the manifest from the official annotations (the full 900-clip media is ~100 GB on YouTube, so only the subset you evaluate is downloaded):
yt-dlp -f "bv*[height<=480][ext=mp4]+ba[ext=m4a]/b[height<=480]" \
  --merge-output-format mp4 -o "%(id)s.%(ext)s" \
  "https://www.youtube.com/watch?v=<videoID>"
python3 prep_videomme.py --parquet /mnt/data/qwen36-mm-eval/raw/videomme_test.parquet \
  --clips /mnt/data/qwen36-mm-eval/videomme-clips \
  --media-root /mnt/data/qwen36-mm-eval/media --link --out manifests/video.jsonl
python3 check.py --all --suite video --url http://192.168.0.88:8000 \
  --model qwen3.6-35b-a3b --emit-records --records-out results/video.jsonl
Operational notes worth carrying over:
- A full 60-item run takes about 1.2 hours at this budget (the diagrams bucket alone is ~28-33 minutes); records are flushed incrementally, so an interrupted run keeps completed items.
- Run the synthetic
smokesuite first; it verifies wiring in minutes and catches plumbing bugs before they contaminate a real run. - Always report the token budget alongside any accuracy figure from this category, and check the truncation count before believing the number.
Conclusion
The useful outcome is not the single number. It is the ability to answer, with evidence:
- Local FP8 serving of Qwen3.6-35B-A3B with the vision tower enabled scores 80.0% on a 60-item MMMU subset, against a published MMMU of 81.7%. Same neighborhood, different item sets, prompts, sampling, and serving.
- The token budget is part of the score. At text-era budgets the same setup looks 22 points worse, entirely from truncation.
- Run-to-run variance on same-config image answers is ~2%, so a regression signal from this eval is trustworthy. Video answers are less stable: the small 5-clip video subset showed ~21% flakiness across two runs, likely because different frame positions change what the model sees.
- Per domain, screenshots and charts are strong; natural photographs are weakest. That split is the actionable part when deciding what to point this model at.
Published benchmarks are the map. A small local eval is the compass check. Keep both.
Resources
- https://huggingface.co/Qwen/Qwen3.6-35B-A3B-FP8 -- model card with the published language and vision-language benchmark tables
- https://qwen.ai/blog?id=qwen3.6-35b-a3b -- Qwen3.6-35B-A3B blog post
- https://huggingface.co/datasets/MMMU/MMMU -- the MMMU dataset (validation split used here)
- https://github.com/FlashML-org/FreeToken -- FreeToken inference server used to serve the model
- OpenCode + a Self-Hosted Qwen3.6 Server: Provider Setup and the Chat-Template Fix That Makes Tool Calling Reliable
- Running Qwen3.6-35B-A3B at 262K Context with FreeToken MoE Offload
Published on 9/19/2026